SALCA was finally delivered back to Halo Photonics, 2 hours down the M6 to Worcester. A useful discussion with Guy Pearson ironed out the amends that need to be completed on SALCA, which include:
1) Repositioning of the laser beams or over-rotation of SALCA to eliminate a blind spot that we have discovered.
2) Tweaking of beam magnitude in order to use only 1 ND filter. This will remove the need to perform consequent scans for each wavelength and will therefore greatly increase the quality of our data collection.
3) Installation of a more powerful digitiser that we are hoping will help toward speed SALCA up, either by continuous rotation of the head (without pause for download), or by the increased memory capacity, which would enable one single download at the end of a scan.
4) Investigation into SALCA beam power loss over time.
5) A more permanent mount designed to the amended filter angle, which should allow us to use and change filters on SALCA more easily.
Meanwhile, myself, Mark and Rachel attended the Remote Sensing and Photogrammetry Society Conference 2011 last week in Bournemouth, where Mark and Rachel were both well received in presenting the progress we have made, both practically and scientifically with the SALCA project, paying particular attention to the fieldwork completed and also the progress made with our moisture loss experiments.
Provisionally, we are hoping to retrieve SALCA in early October, which means we will have time to run more calibration tests before taking the scanner back to Delamere to try to catch the leaf off process, which should provide us with more useful phenological data.
Oliver Gunawan
19th September 2011
Monday, 19 September 2011

Friday, 12 August 2011
Leaf Drying and Range Calibration
Before SALCA is taken back to Halo Photonics, we need to complete a couple of experiments in order to make better use of the data sets we have already collected and to see if future plans are viable. Consequently,I have completed a leaf drying test and also a close-range calibration experiment.
The leaf experiment was carried out using a fresh, whole leaf, which was fitted into a pre-weighed mount and placed next to 2 panels of known reflectances. The three targets were then scanned repeatedly over the course of 3 days with the mounted leaf being weighed after each scan. The purpose of this experiment is to see if the ratio of the two wavelengths changes during the drying process (as theory indicates), which would then be a useful indicator of moisture levels within canopies.
The close-range experiment is important because we have found a fluctuation in intensities at ranges of 0.25 m - 7 m. This experiment was conducted using 2 panels of known reflectance. One panel was kept static and another was placed at different distances from SALCA before being scanned. 16 scan positions were measured up to 7m, which should provide useful information for characterising the fluctuation in order to correct any values within this range.
Oliver Gunawan
12th August 2011
 |
| Leaf used in experiment |
 |
| Sand paper, Spectralon panel and mounted leaf |
The leaf experiment was carried out using a fresh, whole leaf, which was fitted into a pre-weighed mount and placed next to 2 panels of known reflectances. The three targets were then scanned repeatedly over the course of 3 days with the mounted leaf being weighed after each scan. The purpose of this experiment is to see if the ratio of the two wavelengths changes during the drying process (as theory indicates), which would then be a useful indicator of moisture levels within canopies.
 |
| Leaf drying experiment |
The close-range experiment is important because we have found a fluctuation in intensities at ranges of 0.25 m - 7 m. This experiment was conducted using 2 panels of known reflectance. One panel was kept static and another was placed at different distances from SALCA before being scanned. 16 scan positions were measured up to 7m, which should provide useful information for characterising the fluctuation in order to correct any values within this range.
 |
| Range Calibration: Left hand panel is stationary. Right hand panel moves in between scans. |
Oliver Gunawan
12th August 2011
Monday, 25 July 2011
Taking the Riegl 390 out
I am accompanied today by Alberto Ramirez to complete scans of some of the plots we visited at the beginning of July using the Riegl Z390 laser scanner. This is a commercial scanner, which has been used extensively by Alberto during his PhD research.
As a commercial unit, the Riegl is much quicker and simpler to set up, however we can only extract the first returns from the collected datasets. We are aiming to gather comparative gap fraction data to use against SALCA and the hemispherical photography. 2 ND0.6 filters were attached side by side to the receiving lens of the scanner as previous research has found the intensities saturate, making further analysis difficult. Using a resolution of 0.1 degrees in both the elevation and azimuth, we complete 2 6 minute scans at each plot (the second scan being positioned perpendicular to the first to collect the full hemisphere).
Building on Alberto's work, we have managed a full 'point-based' approach to gap fraction analysis, where the beam either hits a target 100% or not at all. This produces an underestimation of the gap fraction (the gap appears smaller) because sometimes only part of the beam is interrupted. By weighting by intensity and using only the first return, we are now overestimating the gap fraction, as we are not considering the interception of further returns. The next step is to focus on the effects of additional returns in sequence.
We manage a full day of research, scanning an unprecedented 8 sites across delamere, which should supply a good range of canopy compositions and densities:
Plot 1: Corsican Pine
Plot 2: Oak / Sweet Chestnut / Silver Birch
Plot 3: Sweet Chestnut
Plot 4: Corsican Pine
Plot 5: Larch
Plot 10: Open Corsican Pine
Plot 11: Dense Corsican Pine
Plot 14: Dense mixed Deciduous
Oliver Gunawan
25th July 2011
 |
| The Riegl Z390 at plot 2 |
As a commercial unit, the Riegl is much quicker and simpler to set up, however we can only extract the first returns from the collected datasets. We are aiming to gather comparative gap fraction data to use against SALCA and the hemispherical photography. 2 ND0.6 filters were attached side by side to the receiving lens of the scanner as previous research has found the intensities saturate, making further analysis difficult. Using a resolution of 0.1 degrees in both the elevation and azimuth, we complete 2 6 minute scans at each plot (the second scan being positioned perpendicular to the first to collect the full hemisphere).
 |
| Alberto with the Riegl at plot 3 |
Building on Alberto's work, we have managed a full 'point-based' approach to gap fraction analysis, where the beam either hits a target 100% or not at all. This produces an underestimation of the gap fraction (the gap appears smaller) because sometimes only part of the beam is interrupted. By weighting by intensity and using only the first return, we are now overestimating the gap fraction, as we are not considering the interception of further returns. The next step is to focus on the effects of additional returns in sequence.
 |
| Robo-baby being transported to plot 1 |
We manage a full day of research, scanning an unprecedented 8 sites across delamere, which should supply a good range of canopy compositions and densities:
Plot 1: Corsican Pine
Plot 2: Oak / Sweet Chestnut / Silver Birch
Plot 3: Sweet Chestnut
Plot 4: Corsican Pine
Plot 5: Larch
Plot 10: Open Corsican Pine
Plot 11: Dense Corsican Pine
Plot 14: Dense mixed Deciduous
Oliver Gunawan
25th July 2011
Friday, 8 July 2011
SALCA Field Trip. Final Day
Thursday 7th July was the last full day of experiments planned in Delamere. In order to get our SALCA scan list up to date, we opted for 1 more Coniferous stand and a larch stand. Alberto and Vishal joined us once again to help conduct field measurements.
As well as the manual field measurements mentioned in previous posts, we also take an opportunity to collect GPS positions of each plot using new Trimble devices acquired by the University of Salford.
The picture below shows an example of a tree infected with Red Band Needle Blight. We were informed by the Forestry Commission that this disease mainly affects Corsican Pines, although the cause is not yet known. For this reason, our final plot was by a cross roads between two pine stands, one of which was more affected by the blight. We are hoping that differences in spectral properties may be picked up in SALCA, which could be useful in monitoring change over time of the disease in particularly badly affected areas.
The final day completed, we celebrated with a fantastic Chinese meal in Hatchmere, not 5 minutes drive from the forest car park. Friday morning was all about getting packed up before taking one last hemispherical photo from plot 1 to complete the set. We have collected almost 50Gb of data and over 100 photographs covering 12 plots:
Plot 1: Coniferous (mainly scotts pine)
Plot 2: Mixed deciduous (sessile oak/sweet chestnut/birch)
Plot 3: Deciduous (sweet chestnut)
Plot 4: Coniferous (scotts pine/corsican pine)
Plot 5: Larch
Plot 10: Open coniferous (scotts pine)
Plot 11: Dense coniferous (corsican pine)
Plot 12: Mixed deciduous (perdunculate oak/sweet chestnut/birch)
Plot 13: Open deciduous (sweet chestnut picnic area)
Plot 14: Dense deciduous (mixture of 6 species)
Plot 15: Open deciduous (Beech)
Plot 16: Between 2 coniferous stands
Let the data processing commence!
Oliver Gunawan
8th July 2011
 |
| Plot 5: Larch stand |
As well as the manual field measurements mentioned in previous posts, we also take an opportunity to collect GPS positions of each plot using new Trimble devices acquired by the University of Salford.
 | |
| Alberto and Vishal conducting field measurements at plot 11 |
The picture below shows an example of a tree infected with Red Band Needle Blight. We were informed by the Forestry Commission that this disease mainly affects Corsican Pines, although the cause is not yet known. For this reason, our final plot was by a cross roads between two pine stands, one of which was more affected by the blight. We are hoping that differences in spectral properties may be picked up in SALCA, which could be useful in monitoring change over time of the disease in particularly badly affected areas.
 |
| Red Pine Needle Blight mainly affecting Corsican Pine |
 |
| Alberto, Vishal, Oliver and Richard by plot 16 |
The final day completed, we celebrated with a fantastic Chinese meal in Hatchmere, not 5 minutes drive from the forest car park. Friday morning was all about getting packed up before taking one last hemispherical photo from plot 1 to complete the set. We have collected almost 50Gb of data and over 100 photographs covering 12 plots:
Plot 1: Coniferous (mainly scotts pine)
Plot 2: Mixed deciduous (sessile oak/sweet chestnut/birch)
Plot 3: Deciduous (sweet chestnut)
Plot 4: Coniferous (scotts pine/corsican pine)
Plot 5: Larch
Plot 10: Open coniferous (scotts pine)
Plot 11: Dense coniferous (corsican pine)
Plot 12: Mixed deciduous (perdunculate oak/sweet chestnut/birch)
Plot 13: Open deciduous (sweet chestnut picnic area)
Plot 14: Dense deciduous (mixture of 6 species)
Plot 15: Open deciduous (Beech)
Plot 16: Between 2 coniferous stands
Let the data processing commence!
Oliver Gunawan
8th July 2011
Wednesday, 6 July 2011
SALCA Field Trip day 3
We are joined today by Richard Armitage, Alberto Ramirez, Vishal Bandagula and Turkia Almoustafa from the University of Salford, who have been involved in previous laser scanning research at Delamere forest. Despite some seriously pessimistic weather forecasts on the breakfast news, the day ends up being quite nice and with only a couple of showers interrupting play, we have managed to get a lot done today.
In the morning, we completed an experiment that Richard Casey has put forward, which involves placing a sheet of material with a known reflectance a distance behind leafy and woody material at plot 12, a mixed deciduous plot. This area was then scanned at high resolution using both wavelengths. When the results have been processed, we will be able to isolate intensities that have come from 100% leaf hits and 100% wood hits. Under the assumption that the reflectance of leafy and woody material does not vary, the intensities collected could give us information on what material the beam has hit and by introducing a linear scale, intensity values can show us the proportion of the beam that the target has covered, which will potentially increase the precision of our gap fraction analysis results.
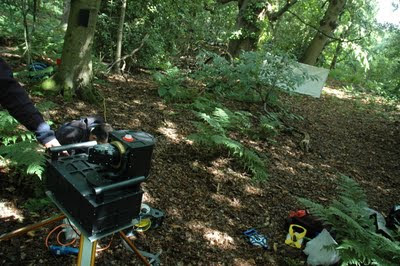
One of our hopes was to use a Reigl 210 scanner to compare our SALCA scan results at each of the plots. However, there has been a technical issue with the Reigl and despite our best efforts, we have not been able to overcome these in the field. We do aim to take the 210 out at some point in the near future, as the data we will collect will be useful in linking this work with previous research conducted by Alberto and Vishal.
In addition to further manual field measurements completed in plot 4, our second scan is completed in an open beech plot (plot 15). This stand has large, old trees and is ideal for a range calibration experiment. As we have not tested how laser intensity changes with range, we place calibration cards with a known reflectance on 8 trees at increasing distances from SALCA. We will be able to compare the results from the intensities of these cards against a theoretical loss of power (1/range squared).

During setup at plot 15, there is a chance encounter with several members of the Forestry Commission. This proves to be a great opportunity for an impromptu demonstration of SALCA and the chance to explain how our research fits into future forest monitoring and management strategies. We also use this as a chance to highlight the benefits of an off-road pram for intensive forestry fieldwork.
Oliver Gunawan
6th July 2011
In the morning, we completed an experiment that Richard Casey has put forward, which involves placing a sheet of material with a known reflectance a distance behind leafy and woody material at plot 12, a mixed deciduous plot. This area was then scanned at high resolution using both wavelengths. When the results have been processed, we will be able to isolate intensities that have come from 100% leaf hits and 100% wood hits. Under the assumption that the reflectance of leafy and woody material does not vary, the intensities collected could give us information on what material the beam has hit and by introducing a linear scale, intensity values can show us the proportion of the beam that the target has covered, which will potentially increase the precision of our gap fraction analysis results.

 |
| Blanket experiment at plot 12 |
One of our hopes was to use a Reigl 210 scanner to compare our SALCA scan results at each of the plots. However, there has been a technical issue with the Reigl and despite our best efforts, we have not been able to overcome these in the field. We do aim to take the 210 out at some point in the near future, as the data we will collect will be useful in linking this work with previous research conducted by Alberto and Vishal.
 |
| Mark and Turkia collecting spectral refectances of leafy and woody material using the ASD |
In addition to further manual field measurements completed in plot 4, our second scan is completed in an open beech plot (plot 15). This stand has large, old trees and is ideal for a range calibration experiment. As we have not tested how laser intensity changes with range, we place calibration cards with a known reflectance on 8 trees at increasing distances from SALCA. We will be able to compare the results from the intensities of these cards against a theoretical loss of power (1/range squared).
 |
| Oliver explaining the operation of SALCA to Richard Mostyn form the Forestry Commission |

During setup at plot 15, there is a chance encounter with several members of the Forestry Commission. This proves to be a great opportunity for an impromptu demonstration of SALCA and the chance to explain how our research fits into future forest monitoring and management strategies. We also use this as a chance to highlight the benefits of an off-road pram for intensive forestry fieldwork.
Oliver Gunawan
6th July 2011
Tuesday, 5 July 2011
SALCA Field Trip day 2
The conditions outside are looking considerably less bright than yesterday, so we head into Chester to collect equipment for experiments we are planning this week.
As we have decided not to scan this morning, we decide to start the manual field data collection, of plots 2 and 3, which include GPS positioning of the plots and tree measurements such as height (using a clinometer), diameter breast height and species composition, which could be important considering possibile variability of bark and leaf reflectances.
The afternoon brightens up and two deciduous sites are chosen for scanning. The first (plot 13) is near a picnic area and has been chosen as it is a relatively open stand, with large, but dispersed sweet chestnut trees. The second stand chosen (plot 14) is a much denser stand composed of a greater variety of deciduous trees including sweet chestnut, birch, rowan, oak and wild cherry.
Whilst at plot 14, we also collect a selection of dead and live sweet chestnut leaves for further experiments back at the cottage. The wavelengths used by SALCA have the potential to provide a useful index of vegetation moisture content, as high leaf moisture will result in high absorption at 1550 nm. In constrast, the 1040 nm laser will mainly be sensitive to structural characteristics of the leaf. The experiments are the first test of the sensitivity of SALCA to vegetation health and leaf moisture content. A live leaf, a dead leaf from the forest litter layer and a partially oven-dried leaf are scanned at high resolution in both wavelengths to compare the intensity of the return signal. A ratio of the two wavelengths could provide an early indicator and useful measure of vegetation stress, drought and disease in woodland as well as estimates of forest fuel moisture content, a significant factor in determining fire risk. Early results look promising and future experiments will look to quantify the relationships between moisture content and SALCA intensity - check back soon for more results!
Oliver Gunawan & Rachel Gaulton
5th July 2011
 |
| SALCA at plot 13 (open deciduous) |
As we have decided not to scan this morning, we decide to start the manual field data collection, of plots 2 and 3, which include GPS positioning of the plots and tree measurements such as height (using a clinometer), diameter breast height and species composition, which could be important considering possibile variability of bark and leaf reflectances.
 |
| Plot 14 (Dense deciduous) |
The afternoon brightens up and two deciduous sites are chosen for scanning. The first (plot 13) is near a picnic area and has been chosen as it is a relatively open stand, with large, but dispersed sweet chestnut trees. The second stand chosen (plot 14) is a much denser stand composed of a greater variety of deciduous trees including sweet chestnut, birch, rowan, oak and wild cherry.
 |
| Moisture experiment setup. As SALCA is an active laser sensor, scanning in the dark is fine! |
Whilst at plot 14, we also collect a selection of dead and live sweet chestnut leaves for further experiments back at the cottage. The wavelengths used by SALCA have the potential to provide a useful index of vegetation moisture content, as high leaf moisture will result in high absorption at 1550 nm. In constrast, the 1040 nm laser will mainly be sensitive to structural characteristics of the leaf. The experiments are the first test of the sensitivity of SALCA to vegetation health and leaf moisture content. A live leaf, a dead leaf from the forest litter layer and a partially oven-dried leaf are scanned at high resolution in both wavelengths to compare the intensity of the return signal. A ratio of the two wavelengths could provide an early indicator and useful measure of vegetation stress, drought and disease in woodland as well as estimates of forest fuel moisture content, a significant factor in determining fire risk. Early results look promising and future experiments will look to quantify the relationships between moisture content and SALCA intensity - check back soon for more results!
Oliver Gunawan & Rachel Gaulton
5th July 2011
Monday, 4 July 2011
SALCA Field Trip day 1
Today is all about making sure everyone gets to the site, although we make the most of the hot sunshine, by getting our first scan underway early.
In the morning, we selected several additional plots in order to get a wide variety of different species and densities of stands in both coniferous and deciduous areas. We now have a target of 10 sites including the three core plots that we have already covered.
Today, Mark and I are joined by Rachel Gaulton from Newcastle University, who worked with SALCA for a year before I started and has been heavily involved in the calibration and creation of processing methodologies for SALCA and Richard Casey from University College London, who has started a PhD focusing on computer simulation of multi-waveform terrestrial lidar data and who is using some data from SALCA in his research.
Alongside the SALCA scanning, which will take priority this week, several experiments and field measurements have been discussed. Amongst these, an examination of the variability of hemispherical photography as a method for gap fraction analysis is started today and involves photos taken every day at plot 1 to cover a range of weather conditions. These images will then be processed by several different people to assess how much results vary.
We manage to get three scans in today at three different pine stands before retiring to our accommodation for the evening.
Oliver Gunawan
4th July 2011
In the morning, we selected several additional plots in order to get a wide variety of different species and densities of stands in both coniferous and deciduous areas. We now have a target of 10 sites including the three core plots that we have already covered.
 |
| Rachel, Mark and Richard with SALCA at plot 1 |
 |
| Richard, Rachel and Oliver at Plot 11: A dense Corsican Pine stand |
 |
| Fisheye photo from plot 1 |
 |
| SALCA data from plot 1: 1550nm |
We manage to get three scans in today at three different pine stands before retiring to our accommodation for the evening.
Oliver Gunawan
4th July 2011
Subscribe to:
Posts (Atom)